In a recent report about Mello-Roos Community Facility Districts (CFD’s) the California Debt and Investment Advisory Commission (CDIAC) stated:
Despite the potential impacts of evolving mortgage conditions, CFD’s have not reported higher default rates, at least through 2007-2008, but have reported a recent rise in the number of their draws on reserves.
(Mello-Roos bonds are post-proposition 13 financings that are secured by “special taxes” rather than more typical ad valorem taxes. They are mostly issued by school districts, cities and towns and are a popular version of California’s land secured tax exempt finance.)
To date CFD’s have held their own on the default scene, certainly doing better relative to Florida community development districts which are defaulting in droves. We believe the lag in defaults is too lightly appreciated and there will be an elevated default pattern in the next two years.
Like other corners of the real estate markets, Mello-Roos borrowings soared in the 2000-2007 time period. We show CDIAC’s summary for Mello-Roos activity. Nearly 60% of all issuance from 1992-93 was sold during this time period.
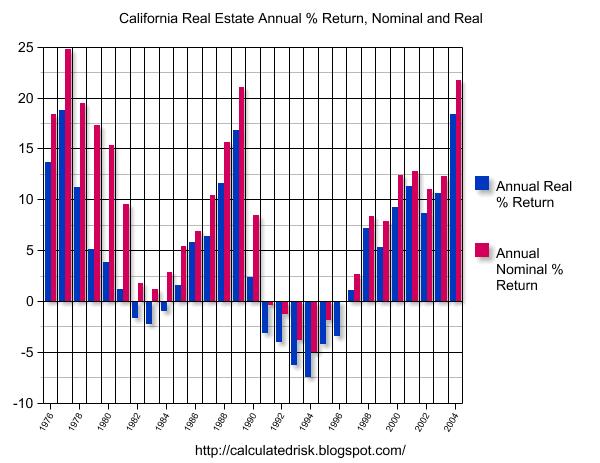
A look at the 1990’s downturn in the California real estate market compared with Mello-Roos defaults is instructive. The Calculated Risk blog posted the following chart in 2005:
Calculated Risk shows the early 1990’s real estate boom had positive growth until 1991 then went negative until finally turning positive 1996.
Now look at the default chart from the CDIAC report.
Two observations: first, as expected, draws on reserves peaked ahead of defaults. Draws hit their high in 1995-96, just when real estate was beginning to climb out of the trough. Second, defaults didn’t peak until 1997-1998 and remained elevated until the 2001-2002 year.
Bill Huck, CEO of S&Y Capital Group points out that building permits are a better indicator of trouble. Building permits began their steady and steep decline in 1985-86 and didn’t trough until 1993.
Baked into this relationship is the assumption that land development must continue for the districts to remain solvent – underscoring the “speculative” nature of this type of finance. So a drop off in building permits correlates with a prediction of future defaults – with a longer lag period than the asset value decline that is grabbing so many headlines today. Once a home is sold, even if it has lost value or is in foreclosure you are most likely to get the Mello-Roos tax payments, Huck commented.
A few factors slow down the default timeline. First, some counties where Mello Roos predominates, such as Orange (but not Riverside) includes districts in the “Teeter” program. Under Teeter the counties pay 100% of the property taxes to the local agencies and then receive penalty and interest payments. The counties have the right to kick out an agency from the program in the next year, so this source of cash flow is not ironclad. Most counties would rationally kick out delinquent payers rather than lose money on their Teeter programs. Second, many CFD’s have debt service reserve funds, so reserve draws are an important early indicator of trouble. Finally, many CFD’s are less leveraged than special districts in other states. The awareness of payment problems has led financial managers to be pro-active, whether through bond refinancing or more aggressive foreclosure resolution. Given that reserve draws are elevated again we expect to see defaults climb in the next few years – or sooner if covering counties exit the Teeter plan.
